The Hidden Costs of ETFs: Fees, Spreads, Taxes, and Tracking Error Explained
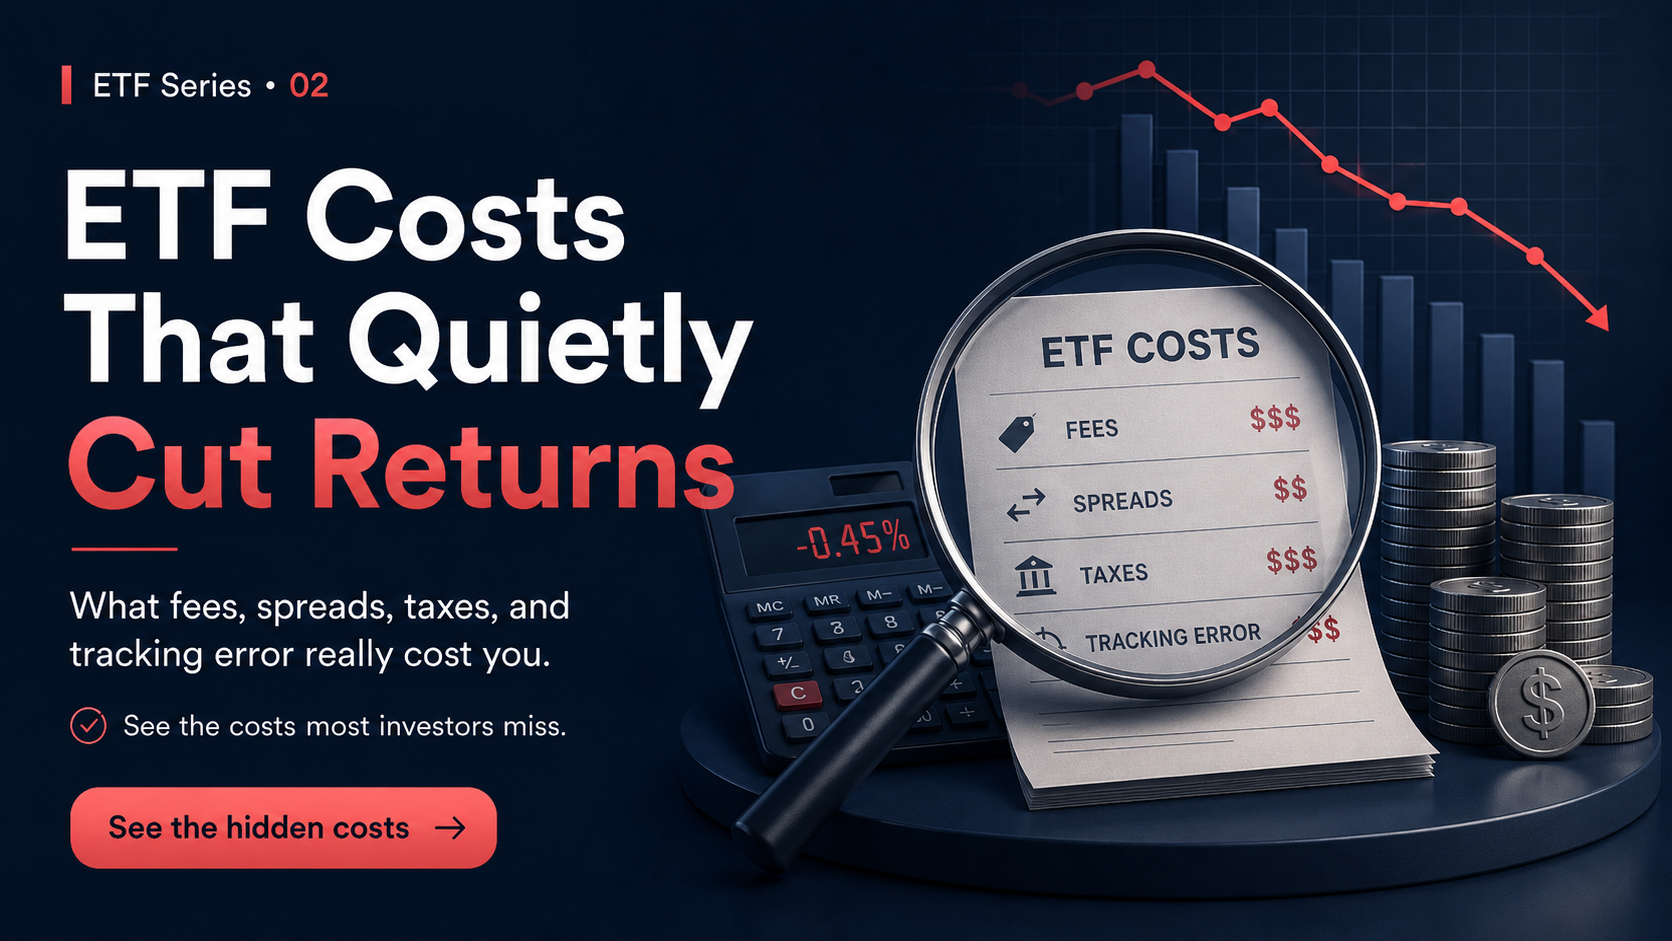
ETFs are often sold as the low-cost answer to investing. And in many cases, they are. But “low cost” does not mean “no cost.”
If you only look at the headline expense ratio, you can miss three other drags on returns:
- Bid-ask spreads when you buy and sell
- Taxes on dividends and capital gains in taxable accounts
- Tracking difference and tracking error, which show how closely the ETF actually follows its benchmark
These costs are easy to ignore because they do not always show up as a line item. But over time, they can matter more than the difference between two similar tickers.
1) Expense ratios: the fee you pay every year
The expense ratio is the annual fee charged by the fund to cover management, administration, custody, and operating expenses. It is expressed as a percentage of assets under management.
For example, a 0.03% expense ratio means you pay about $3 per year for every $10,000 invested. A 0.25% expense ratio means about $25 per year per $10,000.
That sounds small, but it compounds.
Example: $10,000 invested for 10 years
Assume a 7% gross annual return before fund fees.

ETF A expense ratio: 0.03%
ETF B expense ratio: 0.25%

Estimated ending value:
ETF A ≈ $19,616.43
ETF B ≈ $19,216.70

Difference ≈ $399.73
That is the quiet power of fees: the gap is not just the first-year dollar cost. It grows over time because the higher-fee ETF has less money compounding for you.
2) Bid-ask spreads: the cost of trading
ETFs trade on an exchange like stocks, which means you usually buy at the ask price and sell at the bid price. The difference between those prices is the spread.
If an ETF is quoted at $99.98 bid / $100.02 ask, the spread is $0.04 per share, or 0.04% of a $100 share price.
Spread example:
Bid = $99.98
Ask = $100.02
Spread = $0.04 per share

If you buy 100 shares:
Cost = 100 × $100.02 = $10,002

If you later sell 100 shares at the bid:
Proceeds = 100 × $99.98 = $9,998

Round-trip spread cost = $4
That is 0.04% of a $10,000 trade.
For long-term investors, that may be a small one-time cost. For frequent traders, it adds up fast. Wider spreads usually show up in less liquid ETFs, during volatile market conditions, or when trading outside the most active market hours.
Simple way to reduce spread cost: use limit orders instead of market orders, especially for less liquid ETFs.
3) Taxes: the cost that depends on where you hold the ETF
Taxes are often the most overlooked cost because they are not visible in the fund’s fee table. Yet in a taxable account, they can be material.
ETF tax treatment depends on what the fund holds, how often it trades, and the type of distribution it makes. In general:
- Dividends may be taxable in the year received
- Bond ETF income is often taxed as ordinary income
- Capital gain distributions can create a tax bill even if you did not sell shares yourself
- In-kind creation/redemption can help many ETFs reduce capital gain distributions, but it does not eliminate taxes
Here is a simple example:
Tax example:
A fund distributes $1,000 of long-term capital gains.
If your tax rate on long-term gains is 15%,
your tax bill is $150.
That is why asset location matters. In a taxable account, a tax-efficient broad-market ETF can be very attractive. In a tax-sheltered account, taxes may be less urgent today, but they still matter over the long run.
The practical takeaway: do not assume the lowest-fee ETF is the best choice if it is likely to generate higher taxable distributions for your situation.
4) Tracking difference vs. tracking error: what the ETF actually delivers
An ETF may be designed to follow an index, but it will not match it perfectly. Two related terms matter here:
- Tracking difference = the average return gap between the ETF and its benchmark over a period
- Tracking error = how volatile that return gap is over time
Tracking difference is easy to understand: if the benchmark returned 10.00% and the ETF returned 9.86%, the tracking difference is -0.14%.
Tracking error is about consistency. A fund might have a small average gap but still bounce around from month to month because of sampling, rebalancing, cash drag, trading costs, or securities lending results.
Tracking difference example:
Benchmark return = 10.00%
ETF return = 9.86%

Tracking difference = -0.14%
On $10,000, that is about $14 for that year.
In plain English: expense ratio is not the whole story. Two ETFs with the same published fee can still deliver different net returns because of trading frictions, replication method, and portfolio management details.
Worked example: total cost on a real-world ETF decision
Imagine you are choosing between two ETFs that track similar large-cap U.S. stocks:
- ETF A: 0.03% expense ratio, tight spread, low taxable distributions
- ETF B: 0.25% expense ratio, wider spread, slightly less tax-efficient
Suppose you invest $10,000 and hold for 10 years with a 7% gross market return before fees.
- Expense ratio difference: about $22 per year in the first year
- Compounding effect: about $399.73 less ending value for the higher-fee ETF after 10 years
- Spread cost: roughly $4 round-trip on a $10,000 trade if the spread is 4 cents per share around $100
- Tax cost: depends on distributions and your tax bracket; even a single $1,000 gain distribution can create a $150 bill at a 15% rate
- Tracking gap: a 0.14% annual lag equals about $14 per $10,000 in that year
None of those costs alone may feel huge. Together, they can materially change what you keep.
Comparison table: the hidden costs side by side
| Cost | What it is | Simple example | How to reduce it |
|---|---|---|---|
| Expense ratio | Annual fund fee charged from assets | 0.03% on $10,000 = about $3 per year | Compare similar funds and prefer lower fees when all else is equal |
| Bid-ask spread | Difference between the buy and sell price | $99.98 bid / $100.02 ask = $4 round-trip on 100 shares | Use limit orders, trade liquid ETFs, avoid thin market hours |
| Taxes | Tax on dividends, interest, or capital gains distributions | $1,000 gain distribution × 15% = $150 tax | Use tax-efficient ETFs, place assets in the right account type |
| Tracking difference | Average return gap versus the benchmark | Benchmark 10.00% vs. ETF 9.86% = -0.14% | Review historical tracking and understand the index methodology |
| Tracking error | How much that gap varies over time | Small average gap, but inconsistent monthly results | Look for efficient structure, liquidity, and disciplined portfolio management |
ETF cost checklist before you buy
- Check the expense ratio, but do not stop there.
- Estimate the bid-ask spread on the shares you plan to trade.
- Use limit orders if the ETF is thinly traded or volatile.
- Check whether the ETF is likely to distribute dividends, interest, or capital gains.
- Think about account placement: taxable vs. retirement account.
- Review the ETF’s tracking history against its benchmark.
- Read the fund factsheet and prospectus before making a purchase.
- Remember that the cheapest ticker is not always the cheapest ownership experience.
FAQ
Are ETFs always cheaper than mutual funds?
No. Many ETFs are cheaper, but not all. You still need to compare expense ratios, trading costs, taxes, and tracking quality. Some mutual funds can be competitive, especially in retirement accounts or if you trade infrequently.
What is the difference between tracking difference and tracking error?
Tracking difference is the average return gap versus the benchmark. Tracking error is the volatility of that gap. A fund can have a small average lag but still be inconsistent from one period to the next.
How can I lower ETF trading costs?
Trade liquid ETFs, use limit orders, and avoid buying or selling during very thin market hours. If you are investing small amounts frequently, consider whether the spread matters more than the fee headline.
Are ETF tax advantages guaranteed?
No. Many ETFs are tax-efficient relative to comparable funds, but tax treatment depends on the ETF’s holdings, turnover, distributions, and your own tax situation. Bond ETFs and dividend-heavy ETFs can still create meaningful taxable income.
Should I worry about tracking error if the expense ratio is low?
Yes. A low fee is helpful, but a fund can still lag its benchmark because of rebalancing, cash drag, sampling, or other portfolio mechanics. Always look at the total picture.
Bottom line
ETFs are excellent tools, but they are not free tools. The real cost of owning one is the sum of its fee, spread, tax impact, and tracking quality. If you measure those costs before you buy, you will make better decisions and keep more of your return.
Sources
- SEC Investor Alert: ETFs
- FINRA: ETFs
- Vanguard ETF Education
- S&P DJI SPIVA
- Morningstar Active/Passive Barometer
- IRS Publication 550: Investment Income and Expenses
Disclaimer: This article is for educational purposes only and does not constitute investment, tax, or legal advice. ETF costs, taxes, and outcomes vary by fund, account type, trading behavior, and jurisdiction. Consider consulting a qualified financial or tax professional before making investment decisions.
“`json
{
“seo_title”: “The Hidden Costs of ETFs: Fees, Spreads, Taxes, and Tracking Error Explained”,
“meta_description”: “Learn the hidden costs of ETFs—expense ratios, bid-ask spreads, taxes, and tracking error—with simple calculations and a practical checklist.”,
“slug”: “hidden-costs-of-etfs-fees-spreads-taxes-tracking-error”,
“hero_image_filename”: “https://nappot.com/wp-content/uploads/2026/07/02-etf-costs-that-quietly-cut-returns-fees-spreads-taxes-tracking-error.png”,
“social_image_filename”: “social-share-1200×630/https://nappot.com/wp-content/uploads/2026/07/02-etf-costs-that-quietly-cut-returns-fees-spreads-taxes-tracking-error.png”,
“source_urls”: [
“https://www.sec.gov/investor/alerts/etfs.pdf”,
“https://www.finra.org/investors/insights/etfs”,
“https://investor.vanguard.com/investor-resources-education/etf”,
“https://www.spglobal.com/spdji/en/research-insights/spiva/”,
“https://www.morningstar.com/lp/active-passive-barometer”,
“https://www.irs.gov/publications/p550”
]
}
“`